World Economic Forum: 24 charts every leader should see
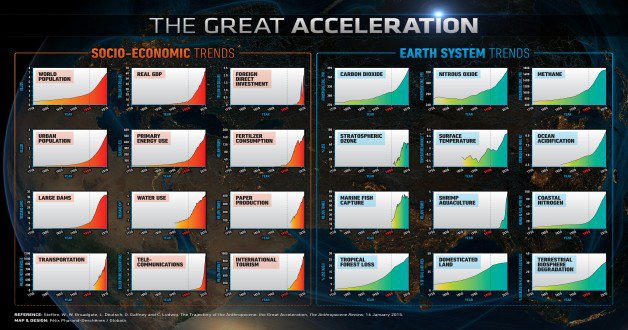
From the impact of the industrial revolution to today’s rapid urbanisation and the climate trends that made 2014 the warmest year on record, these charts are a snapshot of our changing world.
They testify to a great acceleration of humanity’s impact on our planet and the “new global context” that leaders operate in. In a single human lifetime, Earth has moved to a quantifiably new state.
For the respective charts on Population, Economic Growth, Foreign Direct Investment, Primary Energy Use, Large Dams, Water Use, Fertilizer Consumption, Paper Production, Urban Population, Transportation, Telecommunications, International Tourism, Carbon Dioxide, Nitrous Oxide, Methane, Stratospheric Ozone, Surface Temperature, Ocean Acidification, Marine Fish Capture, Shrimp Aquaculture, Coastal Nitrogen, Tropical Forest Loss, Domesticated Land, Terrestrial Biosphere Degradation, please visit the website.